A website that cuts barriers to climate action
Client: Citizen Voice, TU Delft
Type: Project-based contract work
Role: UX Designer
Year: 2023/24
Type: Project-based contract work
Role: UX Designer
Year: 2023/24

Cities aim to become climate-proof through various urban interventions, many of which require citizen support and participation. However, citizens don't understand climate risks and don't know how to take action against them. Digital climate action platforms have the potential to reach large numbers of citizens, but they are ineffective and underutilised. Citizens meet Climate reframes this gap by using personalised storytelling, relatable climate data, and interactive journeys to help citizens understand climate risks and see clear paths to action. In this project, I focused on shaping the experience strategy from research through prototyping and evaluation.
A comparative analysis of 13 climate platforms I conducted, combined with in-depth desk research, revealed recurring issues that limit citizen engagement.
Lack of clarity
Existing tools overwhelm with overly technical and unclear information that scares away users.
Lack of guidance
Existing tools don't guide users in taking action in the real world, so knowledge never becomes action.
Lack of engagement
Existing tools are not engaging, nor visually appealing, nor intuitive, so citizens quickly drop out when using them.

Design a digital platform that motivates and empowers citizens to take climate action in real life.
I synthesised the insights from 3 rounds of iterative user testing involving 50+ participants (focused on data visualization strategies, tone of voice, and intuitivity of the user flow) into a set of design principles that guided the final design.
Make climate data clear, relatable, and beautiful
Short, structured narratives with curated graphic design widely outperform dense informational blocks. Additionally, personally relatable stories increase understanding and engagement.
Balance positive and negative communication
Fear-driven messaging communicates urgency but can lead to disengagement if it isn't balanced with positive solution-oriented framing.
Support both individual and collective action
Users feel more motivated when both personal actions and opportunities to join action groups and communities are presented.
Value users' knowledge
When users are actively invited to share ideas and their contribution is valued, they are more likely to stay engaged in the platform.

Participants testing the first paper prototype
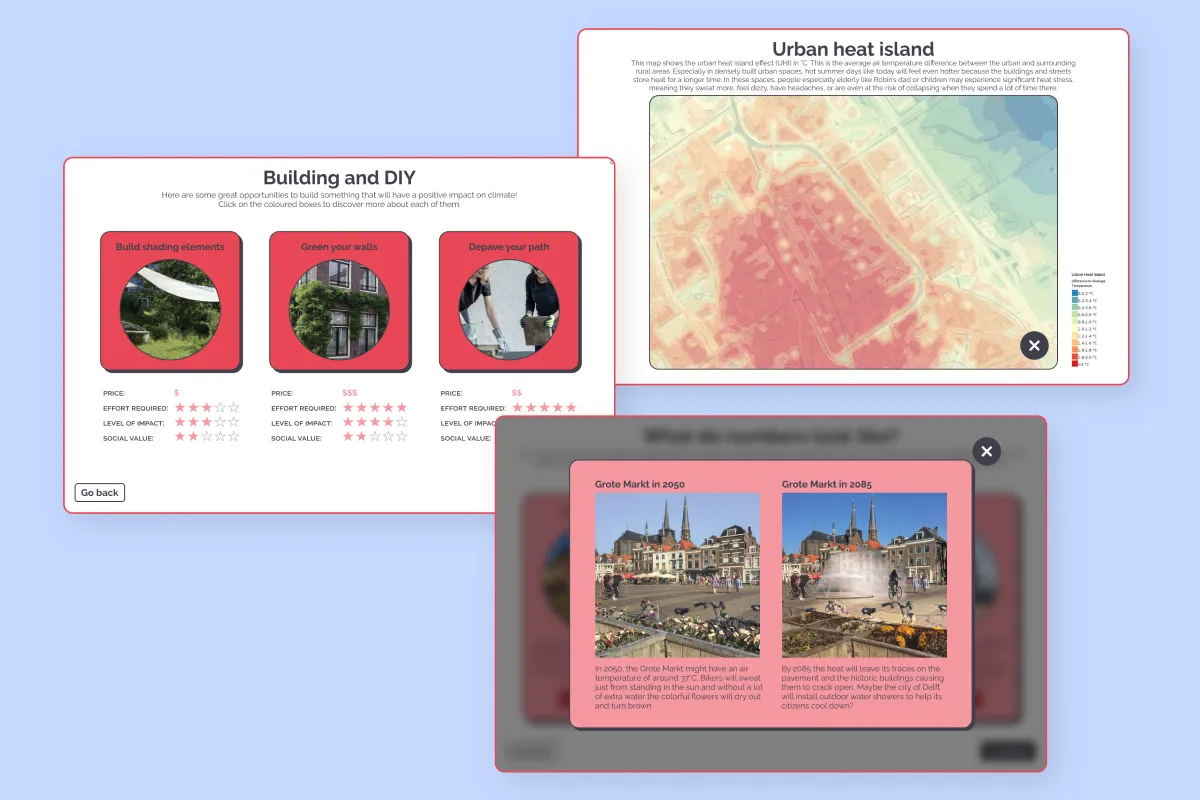
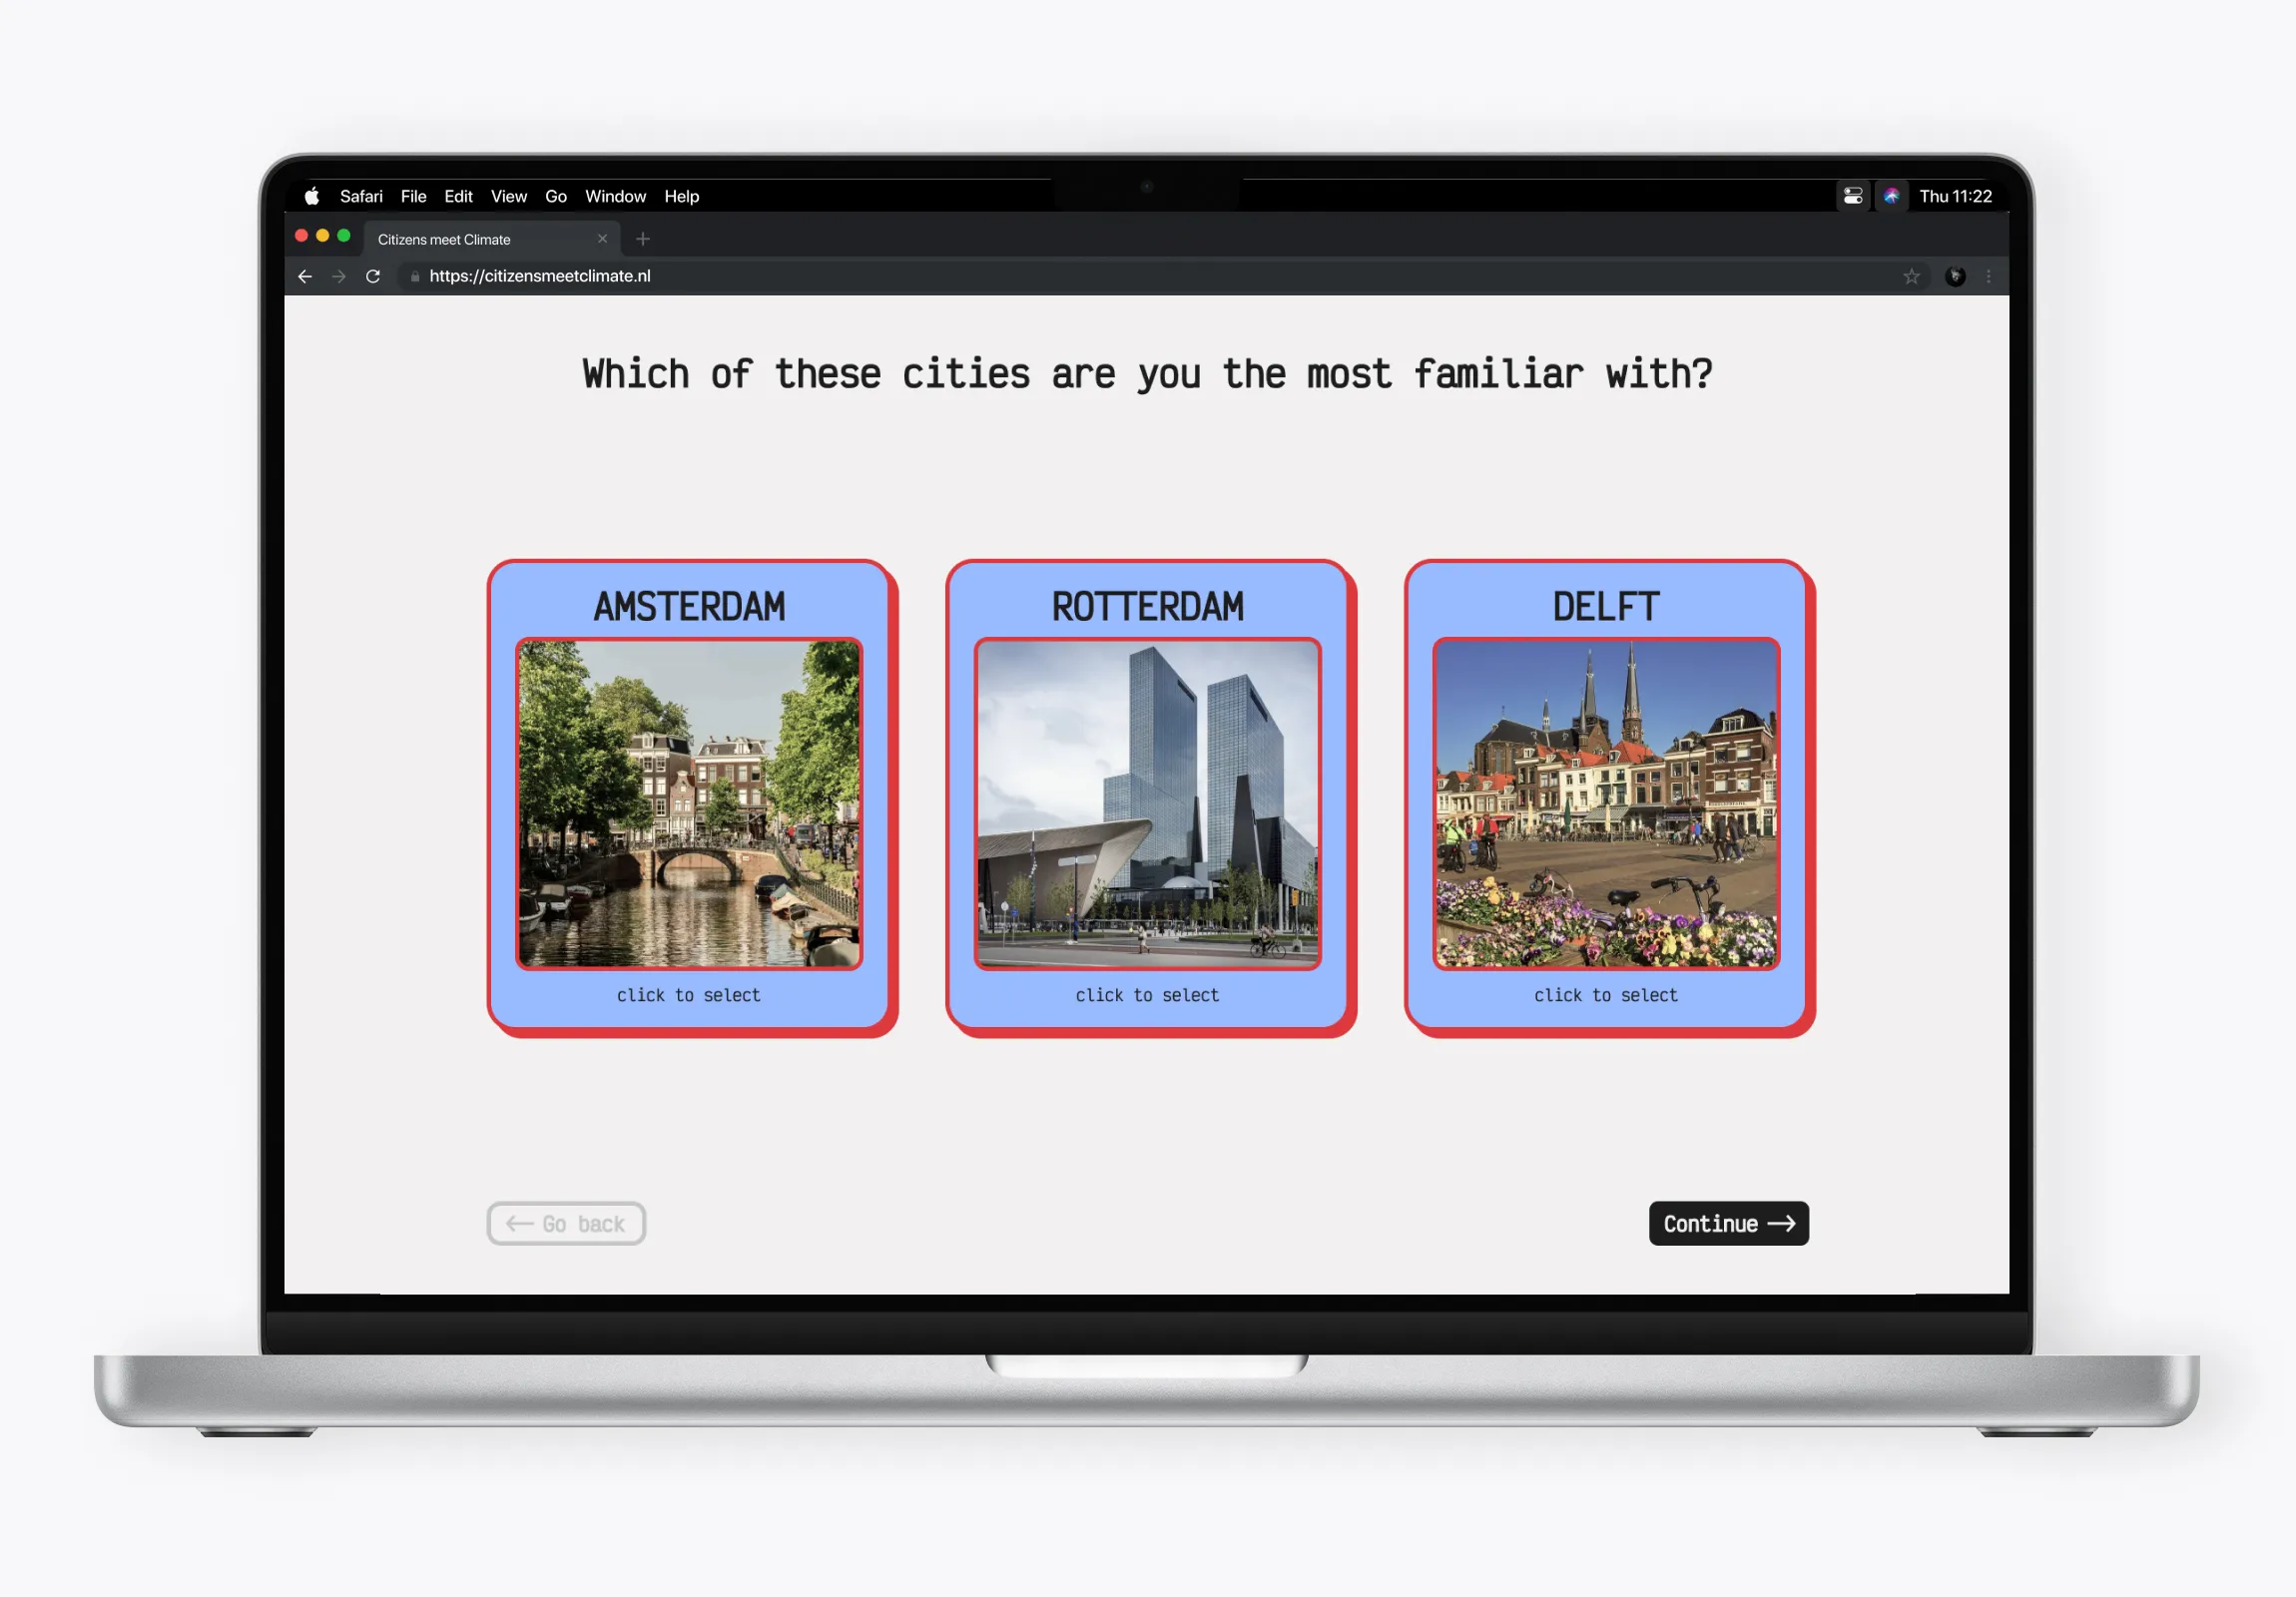
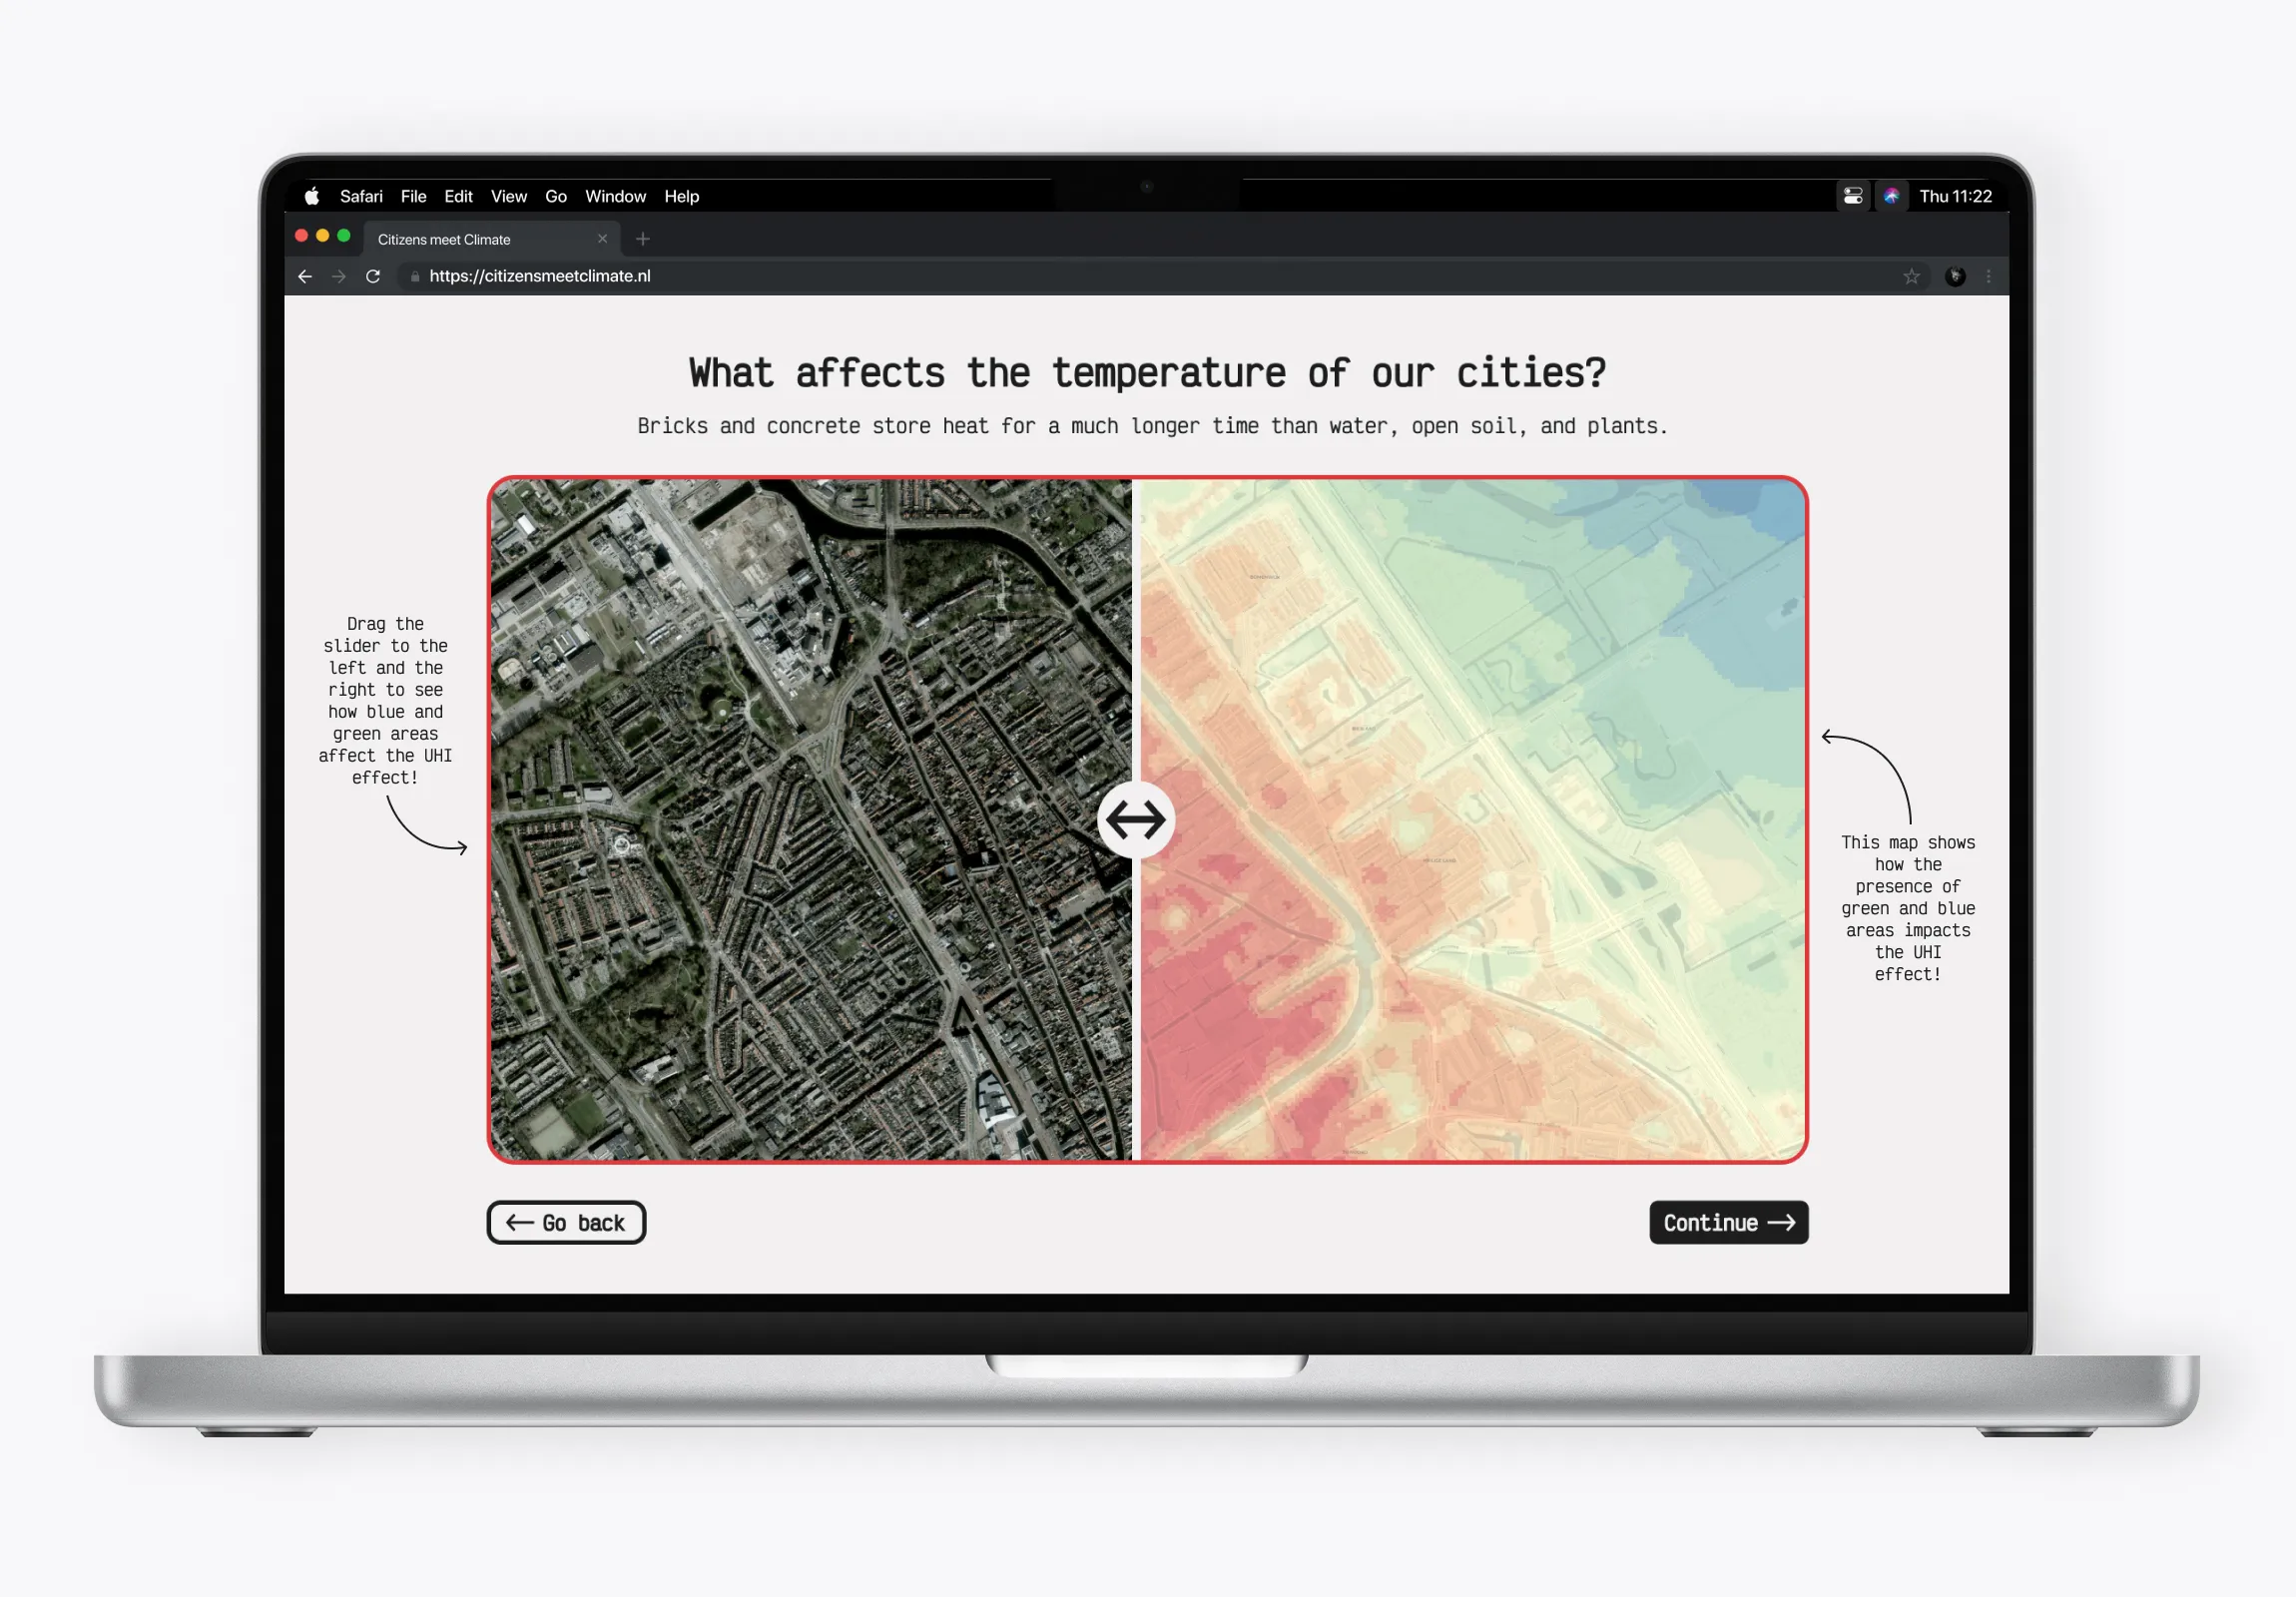
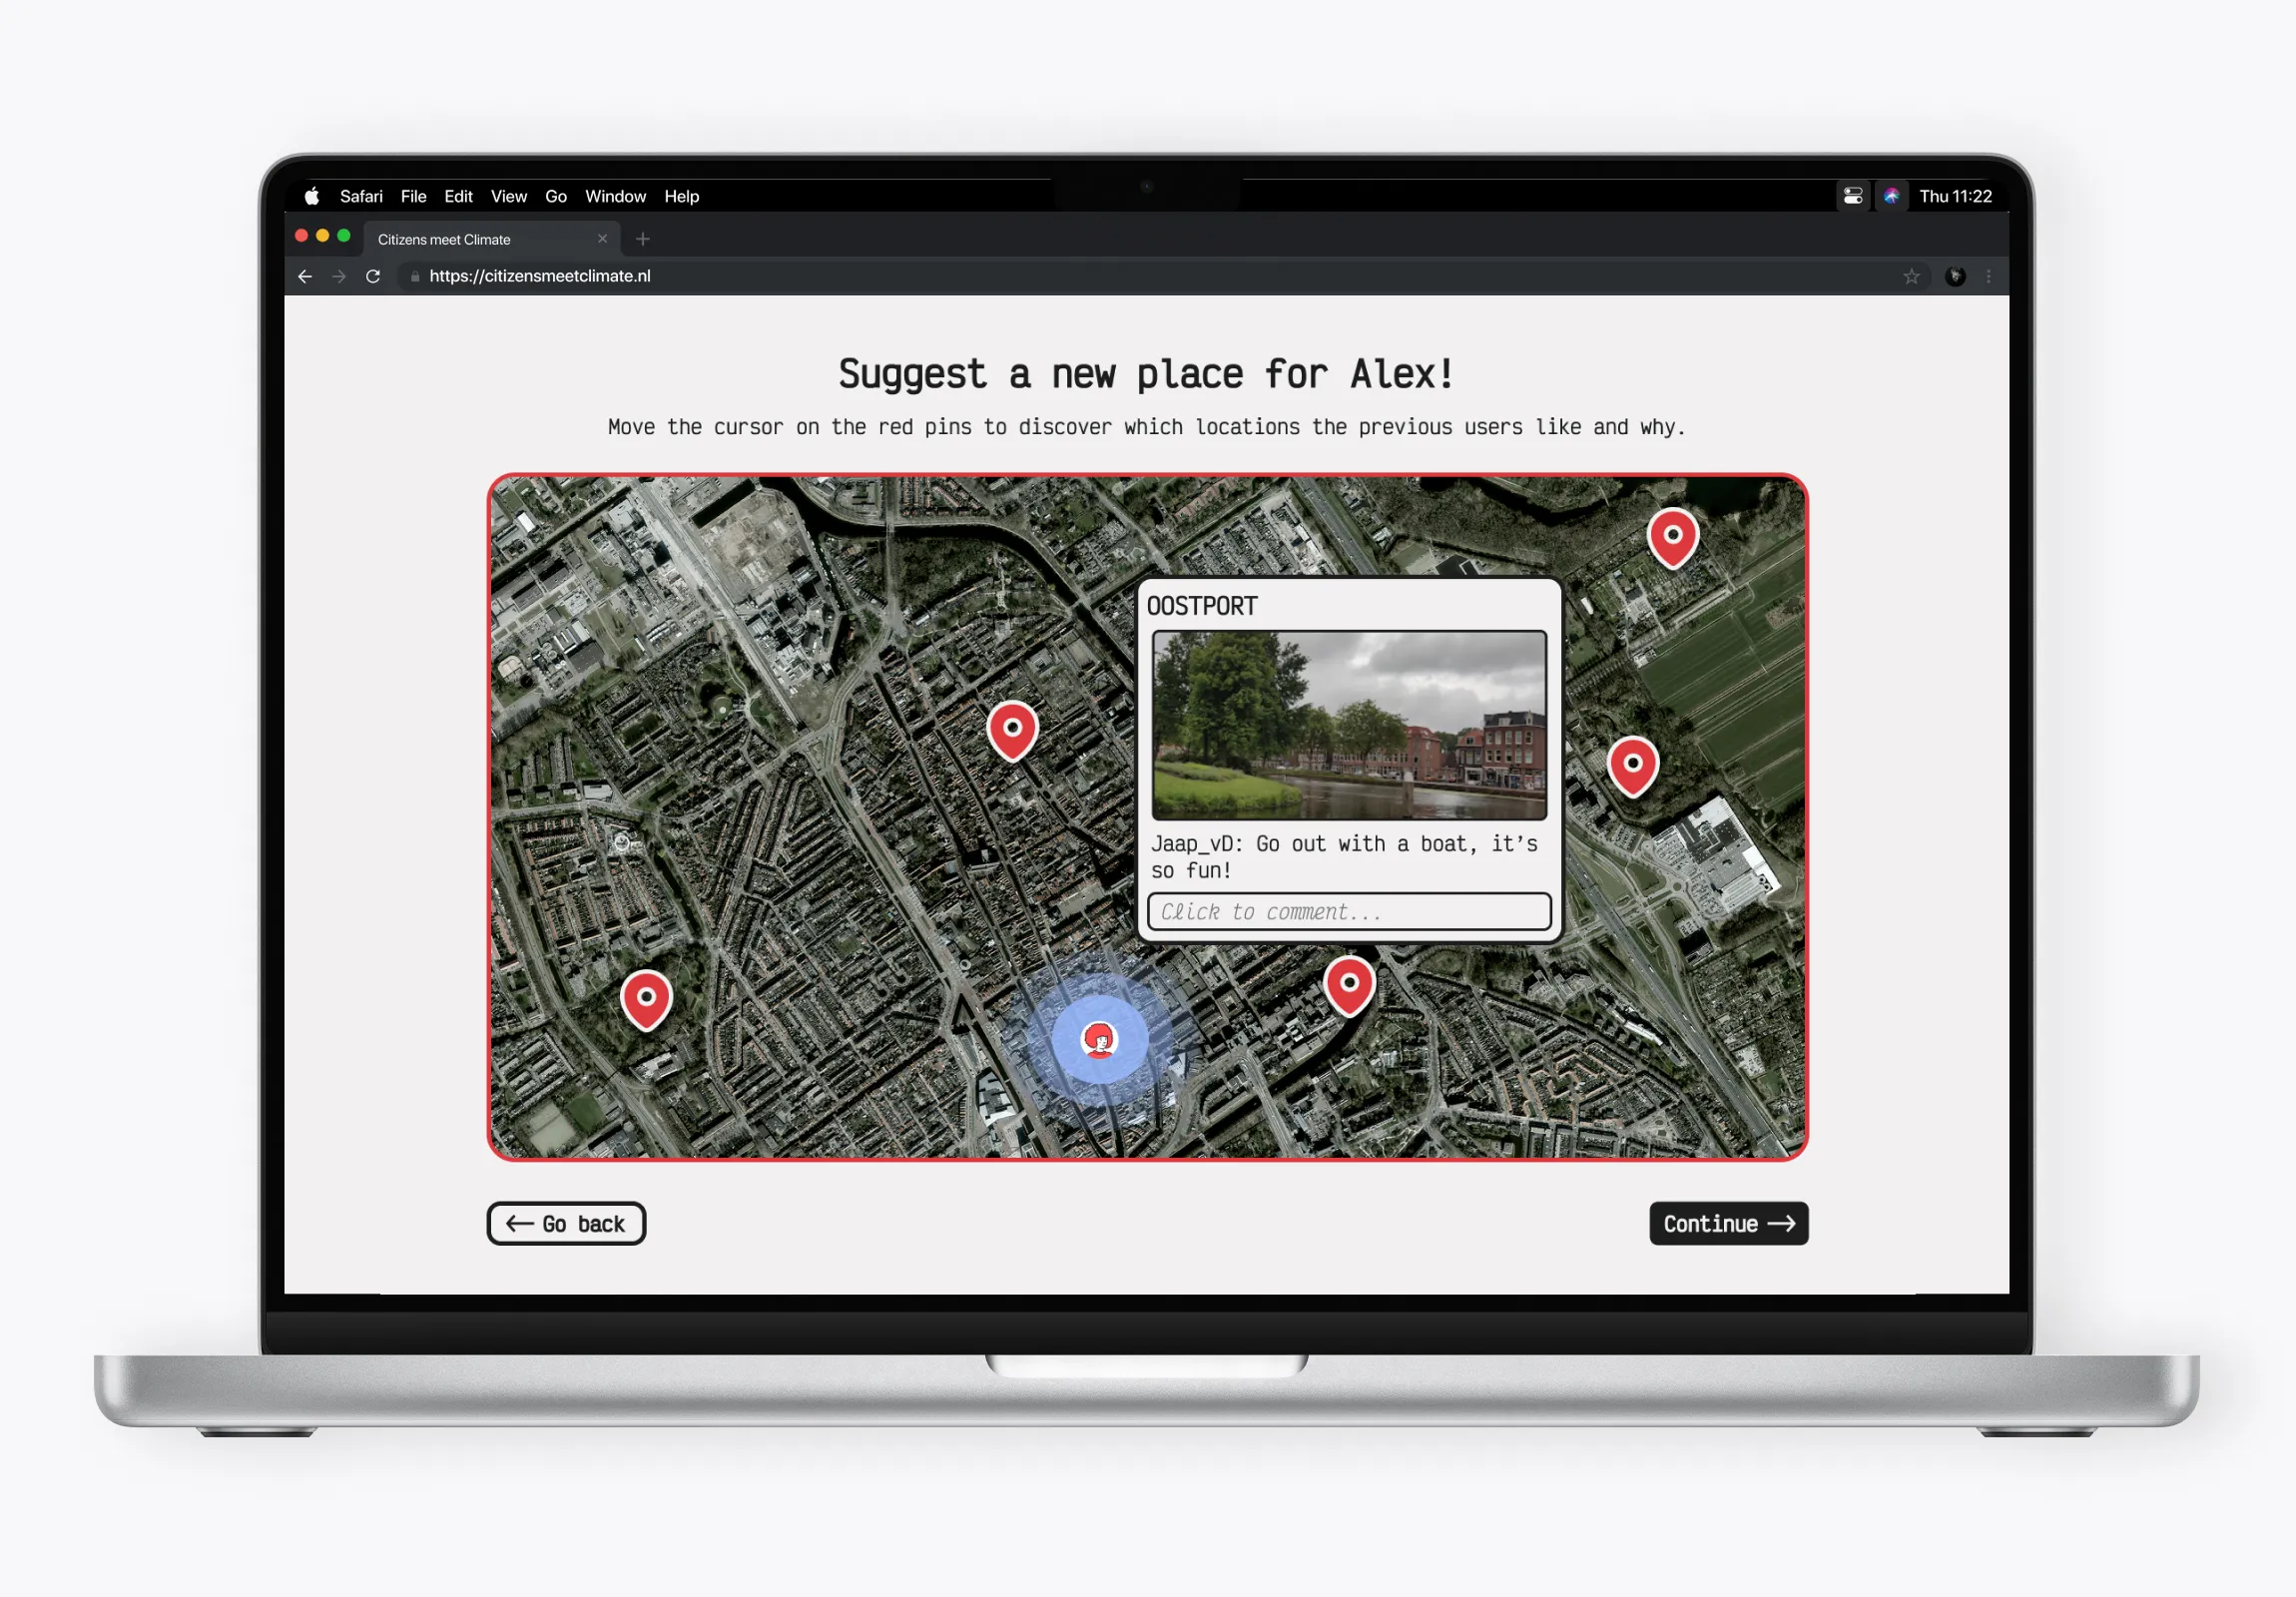
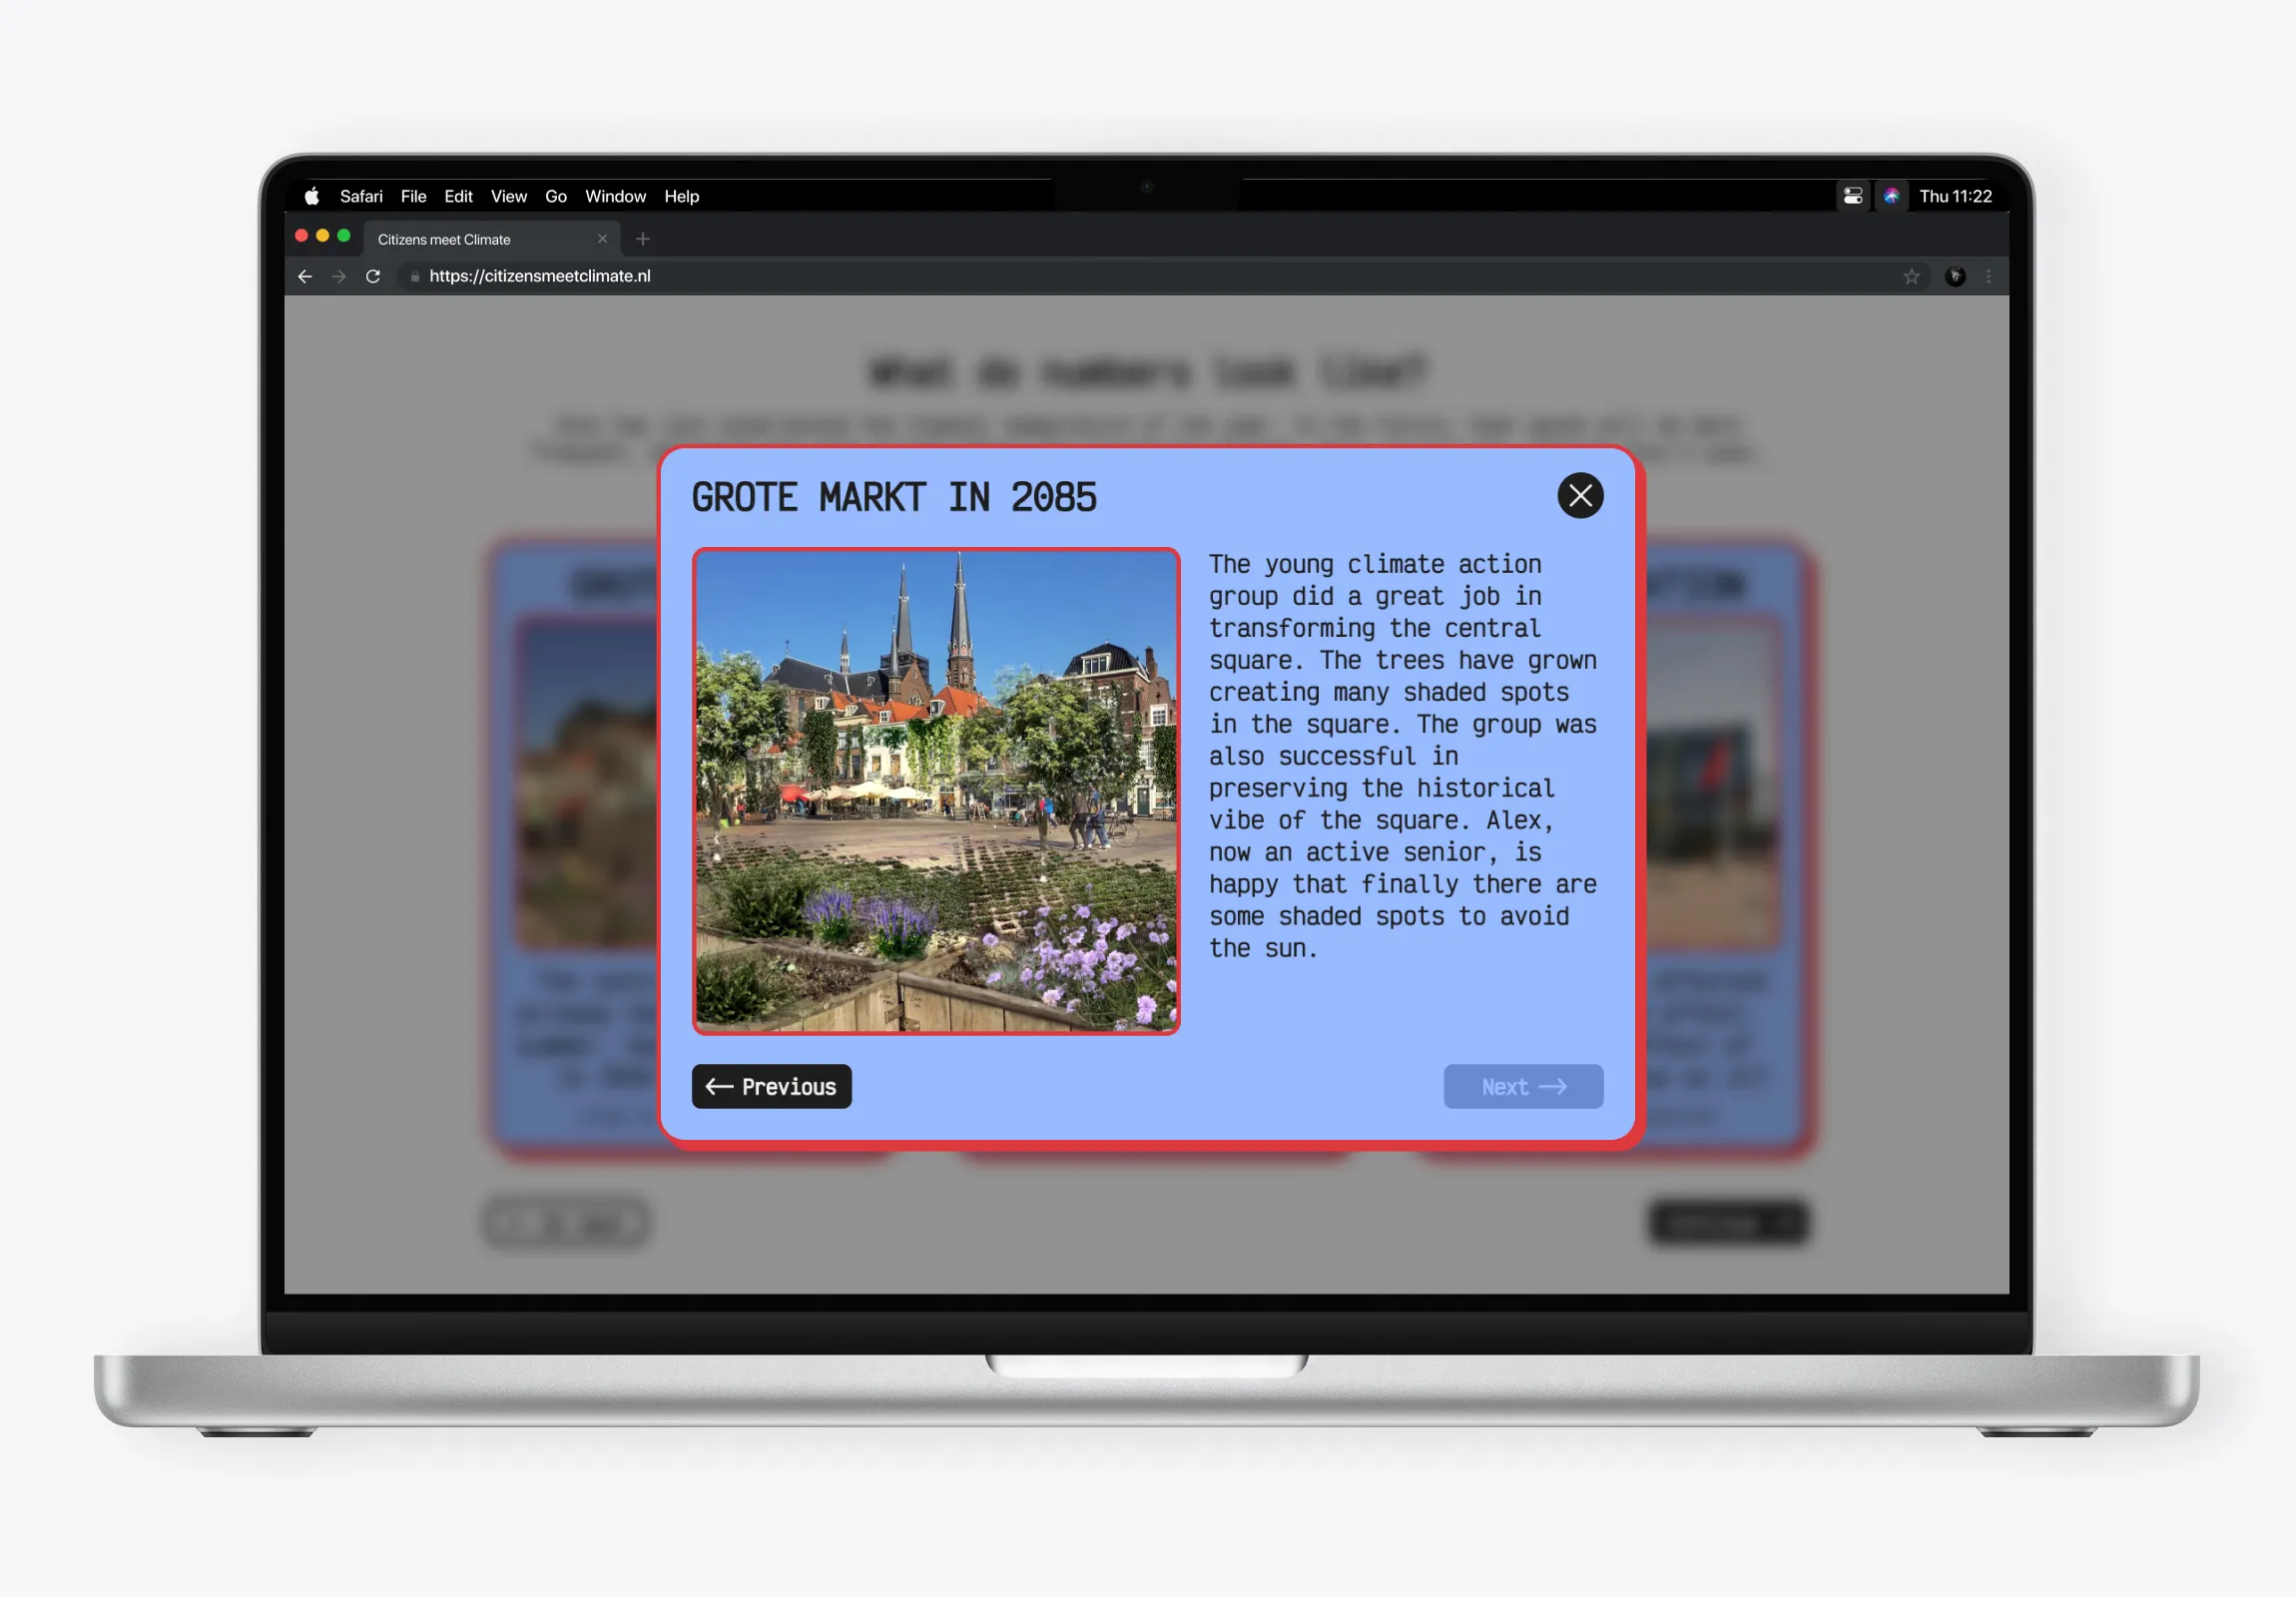
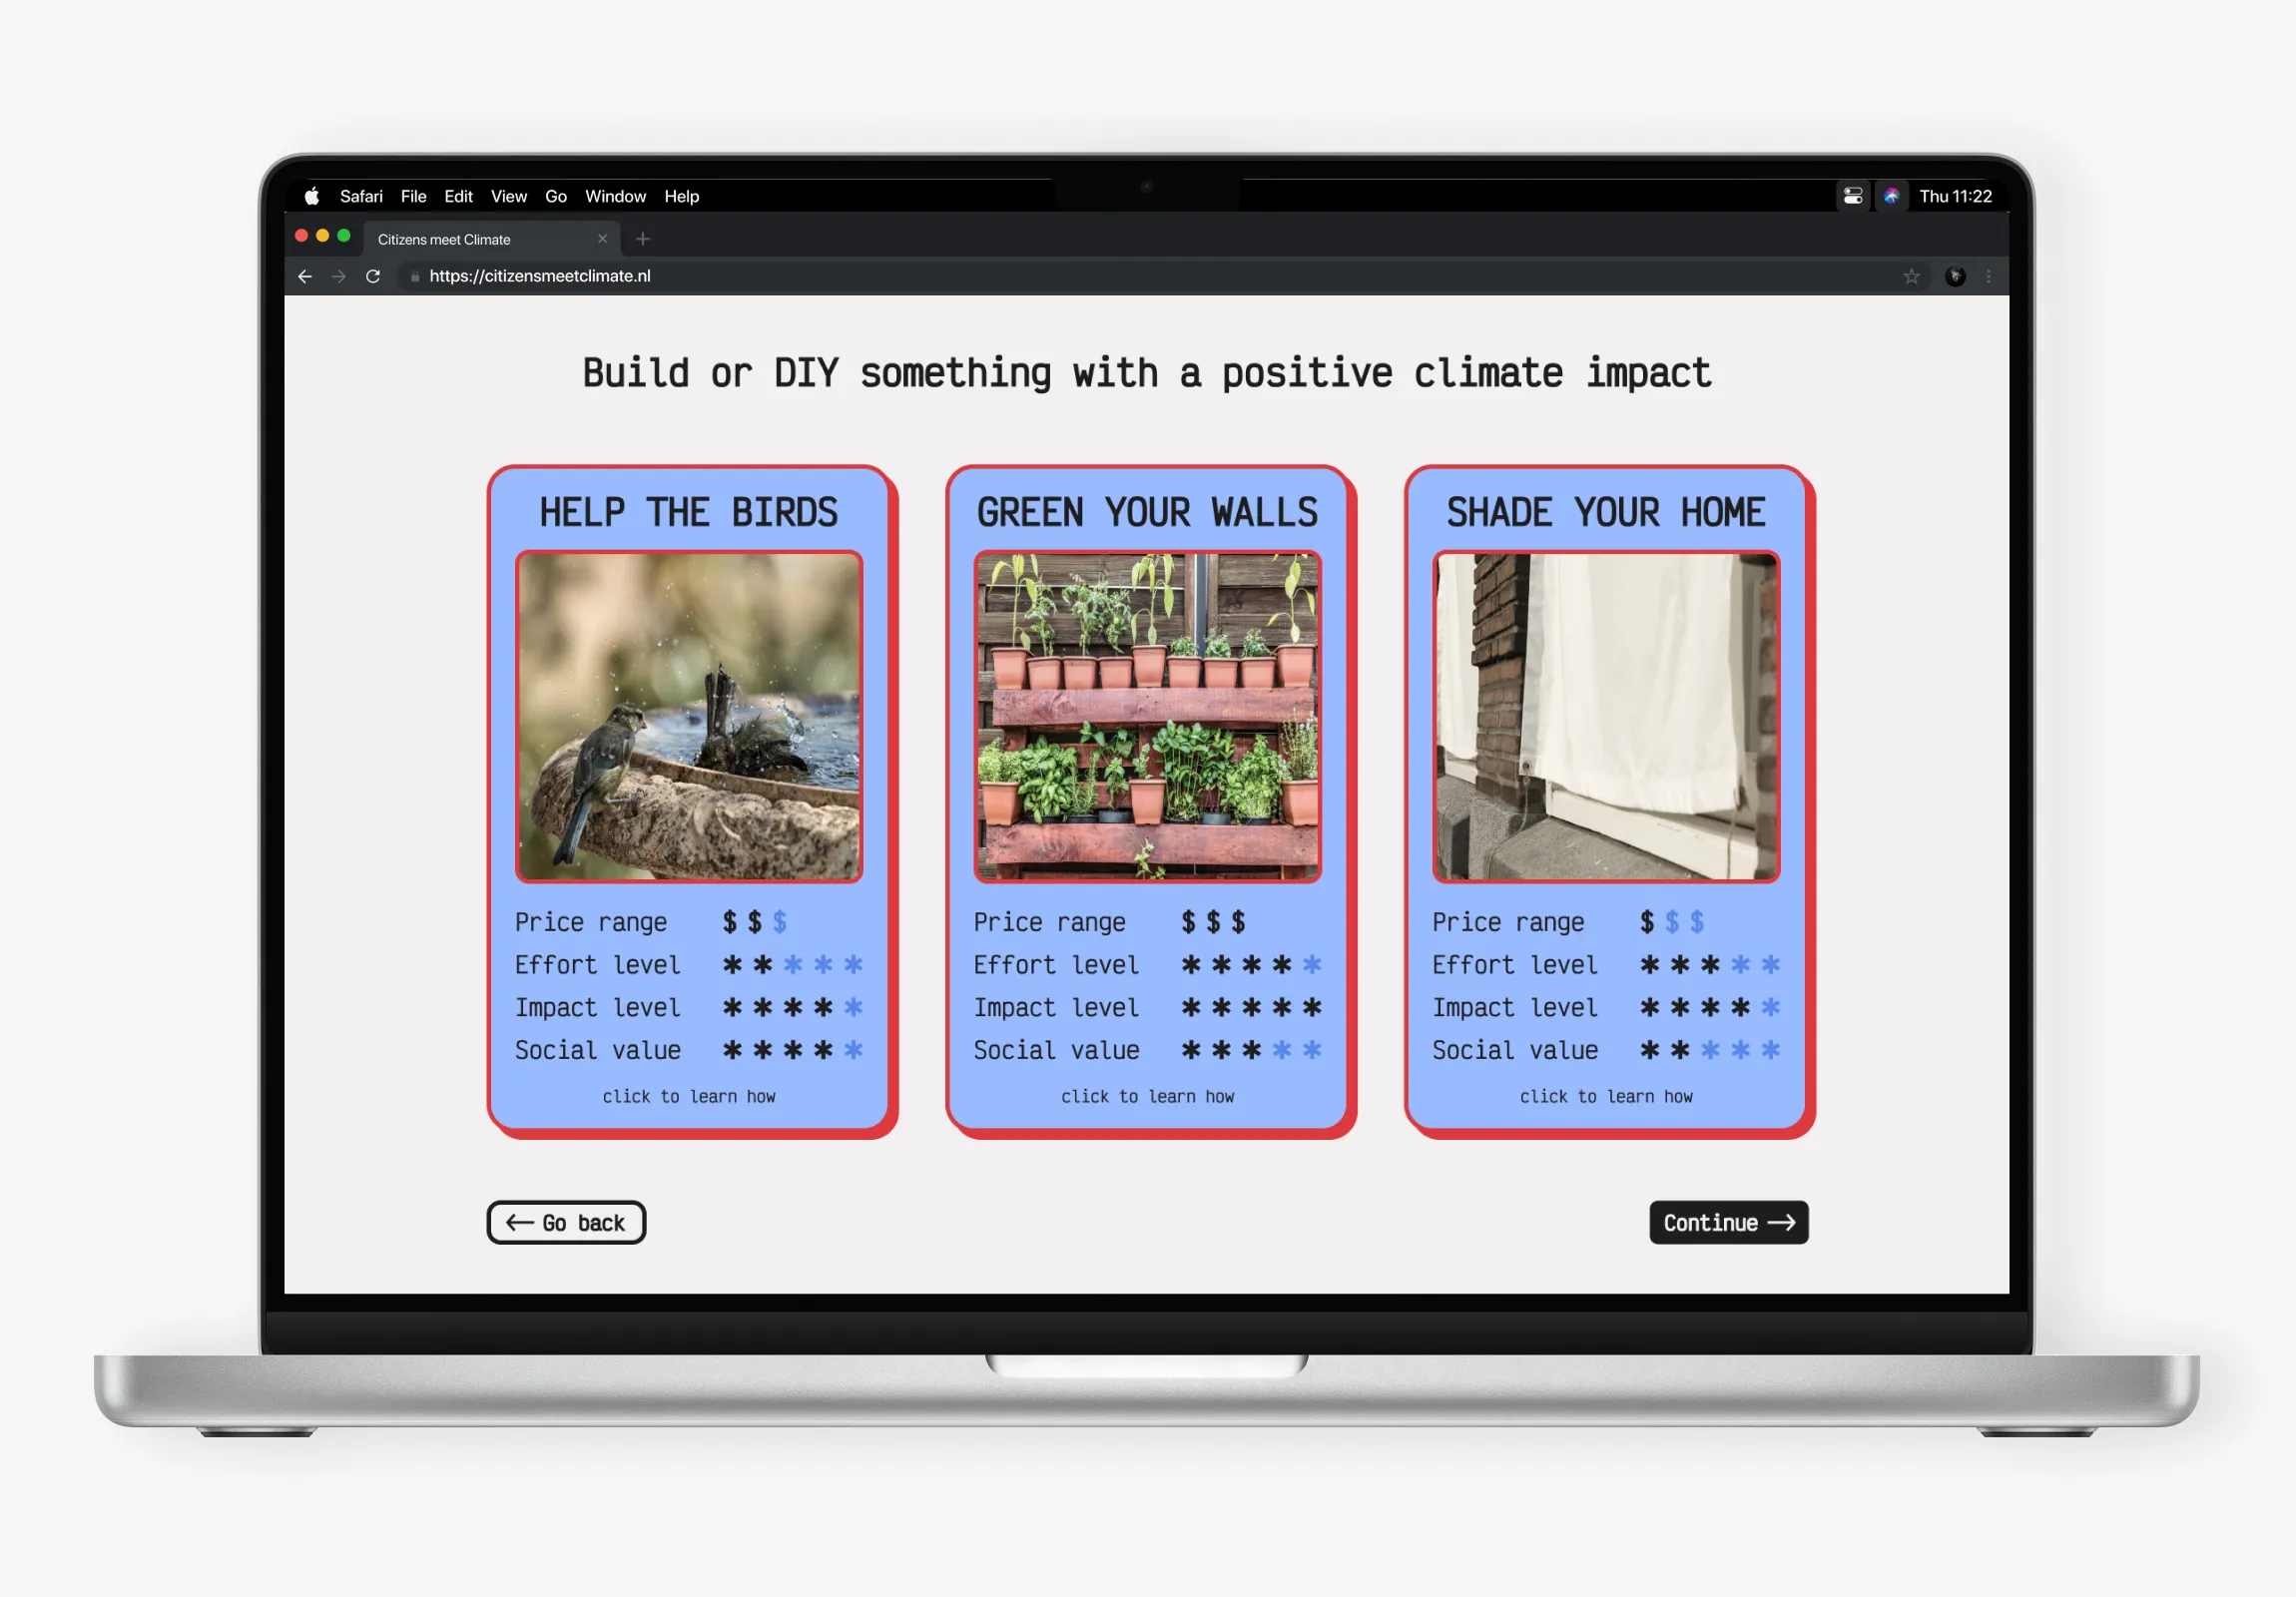
Screens from the first digital prototype
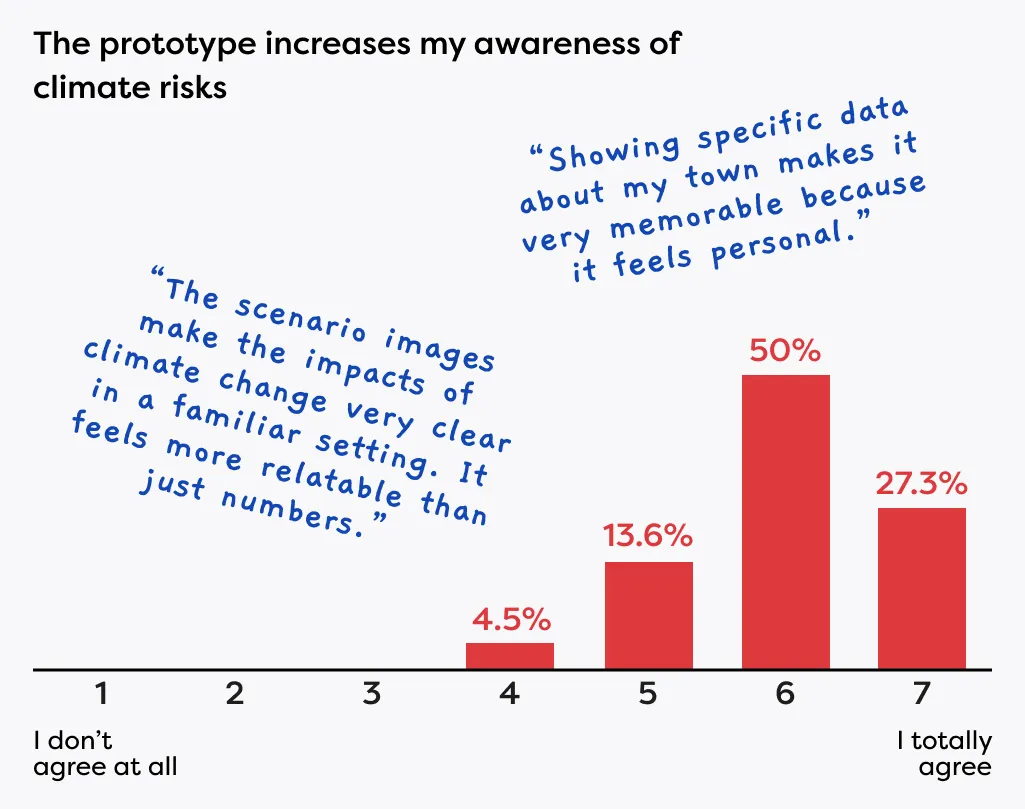
A final validation study, involving 50+ participants across the Netherlands, showed that grounding climate data in local places and future scenarios made climate change feel more relatable and emotionally impactful than abstract information. Participants appreciated the clear overview of local initiatives, which helped lower the barrier to engaging with climate action and reduced the feeling of acting alone. Overall, the experience was perceived as informative and motivating, especially through visual storytelling and maps.
However, testing also revealed a key tension: while users felt encouraged to reflect and explore options, they wanted clearer pathways to meaningful action and feedback, as well as stronger community interaction to sustain long-term engagement.
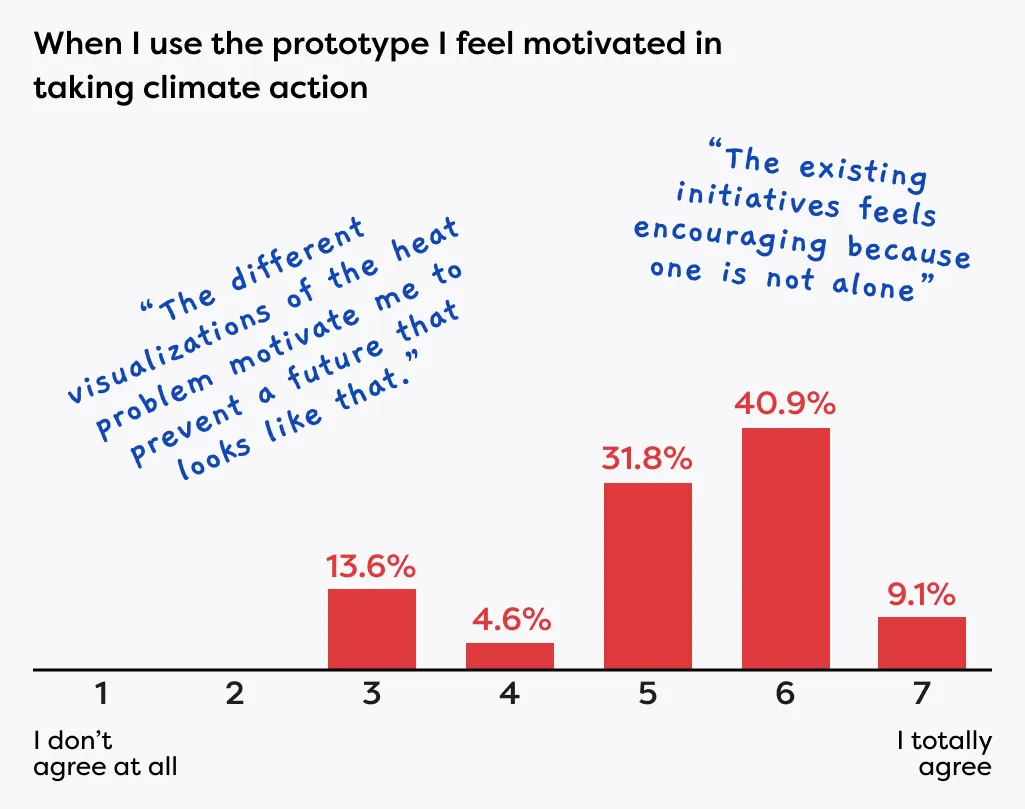
Insights from the final project evaluation's feedback form
Insights from the final project evaluation's feedback form
Design the before and after
Explore how people encounter the platform in the first place, and which triggers motivate them to engage before actively seeking climate information.
Make the community more tangible
Increase the visibility of other participants and ongoing initiatives to reinforce a collective feeling during and after the experience.
Design for return visits
Test cues that support repeat engagement, such as evolving or seasonal local data and progress indicators.


The project was presented at the AMS Institute Scientific Conference, the Climate Action Festival at TU Delft, and the Out-Mathenesse Lentefeest in Rotterdam. It was also selected by 4TU.Federation as part of its 2024 portfolio of design projects exploring design for change.
Read the 4TU.Federation article